Cereals
Insights
Below are cereal our insights. We showcase our visualizations about different cereals, cereal brands, their nutritional values, as well as specific important topics that regard health and wellness.
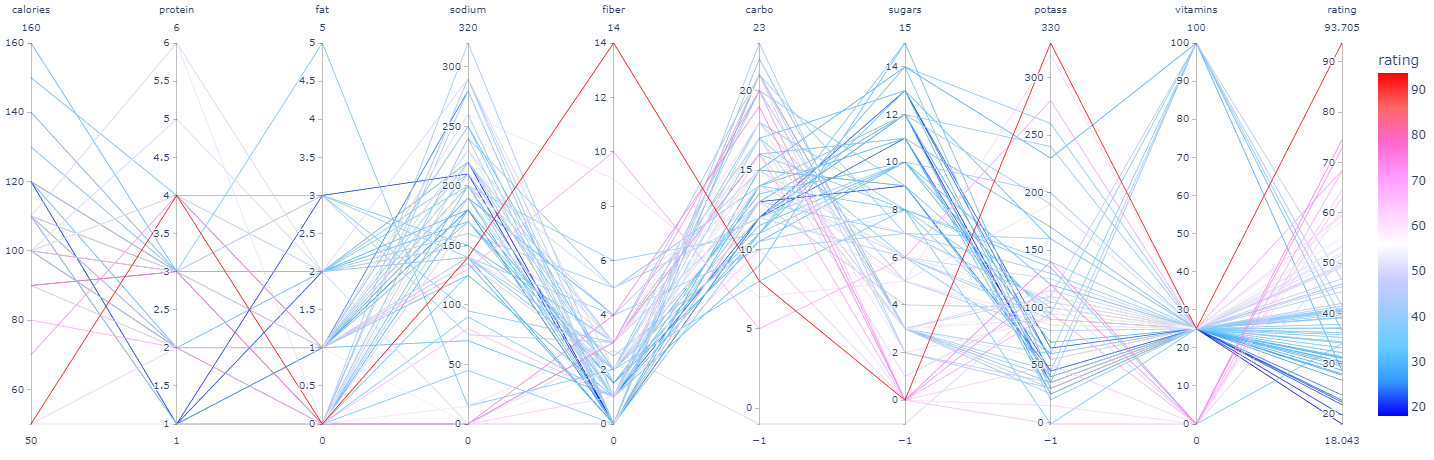
With this parallel chart, we can see where most cereals tend to trend in terms of their calories, protein, fat, sodium, fiber, carbohydrates, sugar, potassium, vitamins, and their overall ratings. With this, we can see that the majority of cereal brands have a wide variety of caloric intake ranging between 50 to 160. But there are 2 heavy hitter points for protein at 1 and 4 grams. Sodium is where it gets interesting as most of them are high in the sodium category. Each of them is above 100 mg and ranges all the way up to 320 mg per serving. Fiber being the lower points for most of the cereals mostly range between 0 and 4 grams. Furthermore, potassium levels are mostly lower than their sugar levels, and vitamins mostly come in at around 25 mgs. But the nice thing about this parallel chart is that we can see where the highest-rated cereals go in each of these factors. We can see the darkest red line (which is considered the healthiest) being higher in protein levels, fiber, and potassium, and low in sugar levels, carbohydrates, and calories. This is a great indicator of what a healthy cereal should be.
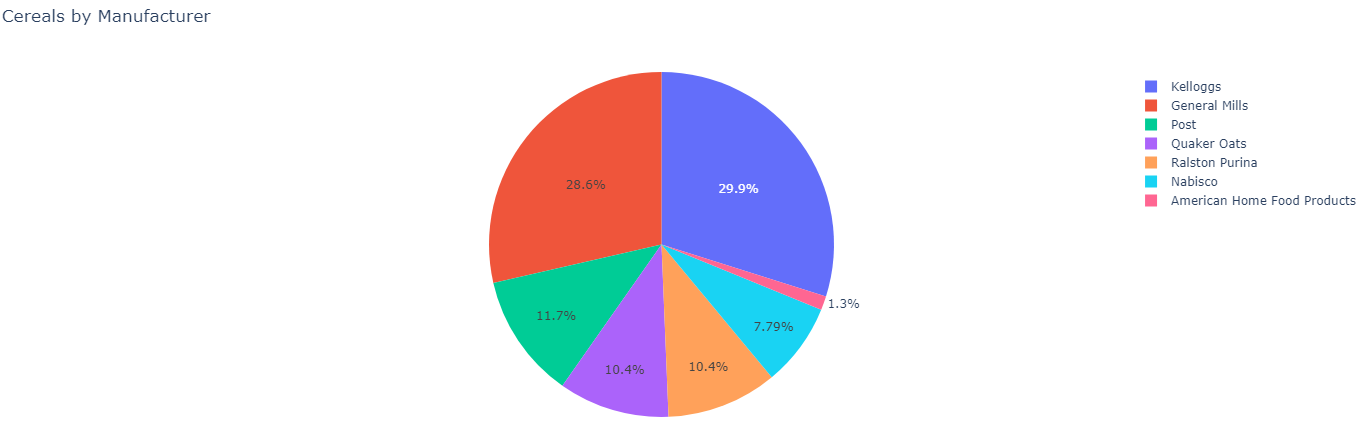
Before we take a deep dive into the nutritional facts of cereals and breakfasts, we need to take a look at which parties currently dominate the market. Within this pie chart above, we can see that there are 2 major dominating manufacturers: Kellogg’s, and General Mills. To give some background information, Kellogg’s and General Mills have not always been the most dominant cereal manufacturers - but through a series of acquisitions: Mass Food Group (K), Keebler Company, Morningstar Farms, Kaishi, Pillsbury, etc. This has allowed them to dominate the landscape with 75 products spread across the two. The other manufacturers listed remain independent and are currently growing in most sectors.
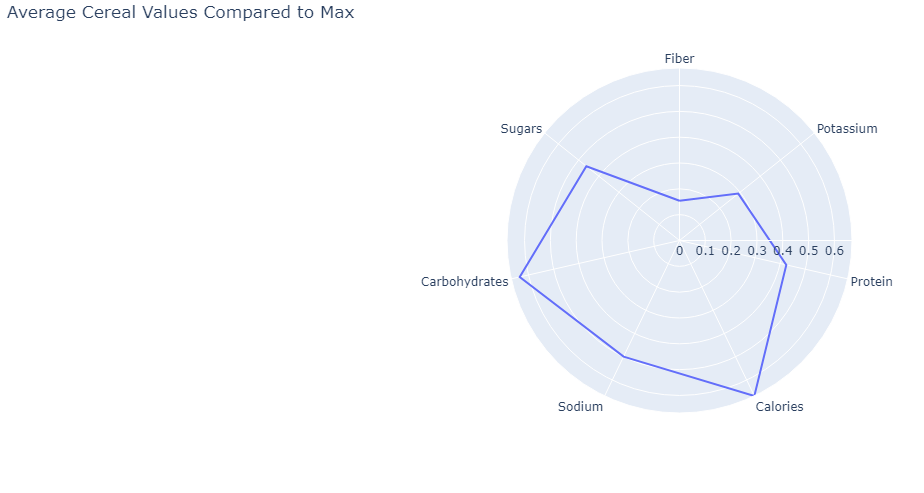
Cereals have 7 main food nutritional facts within them: Carbohydrates, Sugars, Fiber, Potassium, Protein, Calories, and Sodium. That being said, most cereals have numerous different amounts of each of those factors. Within this Radar figure, we can see that the average cereal has and contains in terms of those food nutrient groups. With this, we see the heaviest factors: Calories, Sodium, Carbohydrates, and Sugars. Where they each are above 0.4 units. That being said those who need to watch sodium, carbohydrate, sugar, or caloric intake should read each of the cereal boxes before consuming. But this visualization gives us a great view of what most cereals contain.
Trends
Sugar and Calories
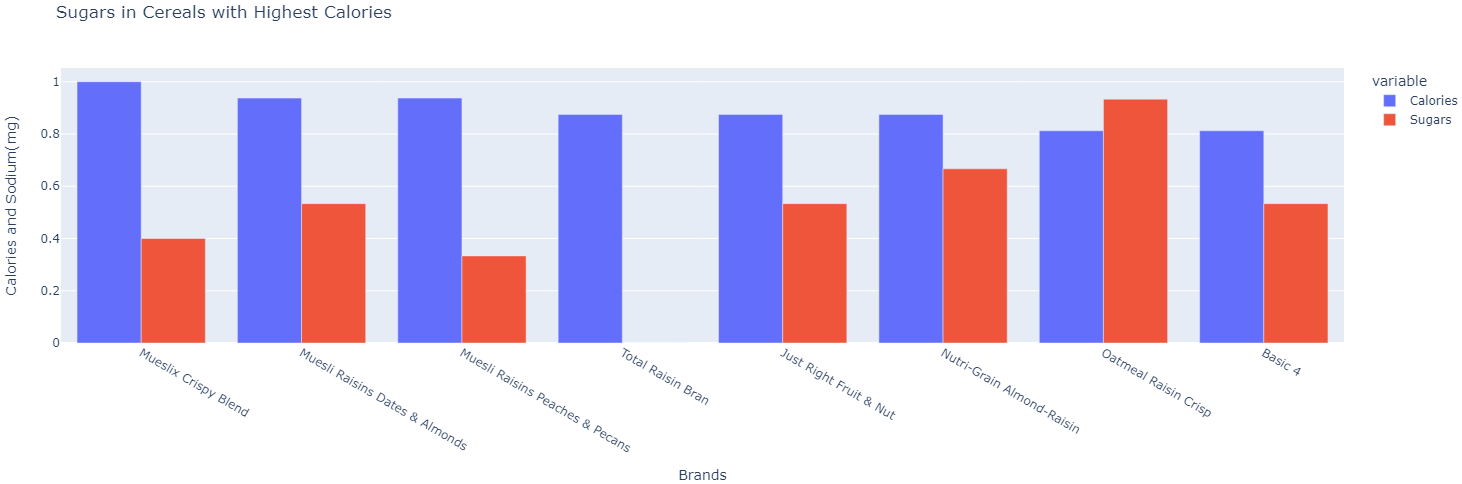
Another big nutritional factor we need to consider is sugar levels within cereals. Sugar is a vital nutrient required by the body in modest quantities (assuming there is no significant sweating) to uphold fluid balance, as well as to ensure the proper functioning of muscles and nerves. On average, the dietary guidelines for Americans recommend adults limit sugar intake to less than 36g per day.Thus, having a super high sugar intake within the cereal brand may be positive or negative for a person. Therefore, consumers must also take into consideration how much sugar is in the cereal brands - and in this case, we used the top caloric values of cereals. Oatmeal Rasin Crisp, a relatively popular cereal brand, is already above 0.8 units of sugar, and with more than 1 serving can take up a huge amount of your daily sugar intake.
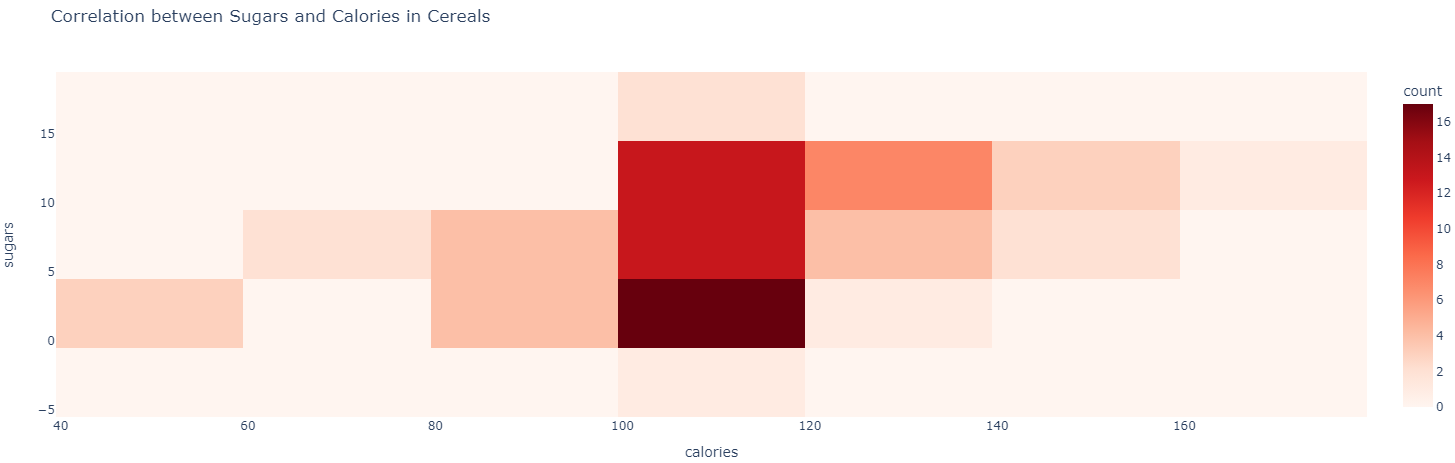
To show a clear representation of where most of the cereals range in between an x-y plot of Sugar and Calorie levels, we decided to use a heat map. This showcases where the majority of the cereal counts are. The darker the red is the more cereals are around there. Thus, we see a lot of cereals ranging between the 100-120 calorie range and also 0 to 15 grams of sugar. However, something nice to see is that we do have 17 cereals that are between the 100-120 calorie range that have equal to or less than 5 grams of sugar.
Cereal vs. Breakfasts
Implementing a 3rd axis of fiber levels allows us to use a clearer visual representation of a 3D scatter plot. This allows us to draw and plot points in which certain cereals may have higher levels of calories, fiber, and sodium together. With this, we can see that the 3 highest overall cereal brands with all 3 nutritional factors combined are All Bran with Extra Fiber, All-Bran, and 100% Bran. Each of them have high intakes of sodium, and the most amount of fibers compared to other cereal brands. But that being said, we can also see that it has one of the highest protein values per serving. However, we can see that each of them don’t have the highest vitamin intake within each, all being 25mg. After doing further research, we can determine that the three Bran cereals are a great source of important micronutrients like iron and folate, but it does tend to be high in added sugars, as well as fiber.
To give a consumer a better understanding of what different breakfast food options there are and how they relate to calories, carbohydrates, sodium, and fiber we wanted to use an interactive 3D scatter plot to showcase where most themes range to - and in particular where most of the high/low fiber foods are. In this, we can see 2 main breakfast foods that are high in dietary fiber: Banana, and Hashbrowns. Each of them produces on the lowest end of protein and sodium as well - thus could be a great combination of food with other higher protein and sodium foods. We can also see that apples are high in fiber and could be a great snack throughout the day as well as a combination item for breakfast.
Conclusions
Overall we can see that cereals are a healthy breakfast food option, they are considerably low in calories. In terms of sodium, they are an adequate amount that suffices for your daily recommended sodium intake of 2300mg. Through our visualizations, we can see that cereals also provide great sources of vitamins and nutrients.